From a theoretical framework to a practical digital tool: five months of testing, reviews and updates.
The DEI4SME Project digital tool was initially a theoretical framework developed by the University of Vaasa team thanks to extensive data gathered via surveyed SMEs and under-represented individuals. The framework was later edited based on focus group discussions and confirmed as blueprint for the practical tool for reporting, planning and learning about social sustainability. With a ready blueprint and a suitable digital tool provider found, the University of Vaasa team started developing the digital tool in January 2026. Within the first four months, the website was drafted, internally reviewed, updated and an approved first version was released for public testing in April.
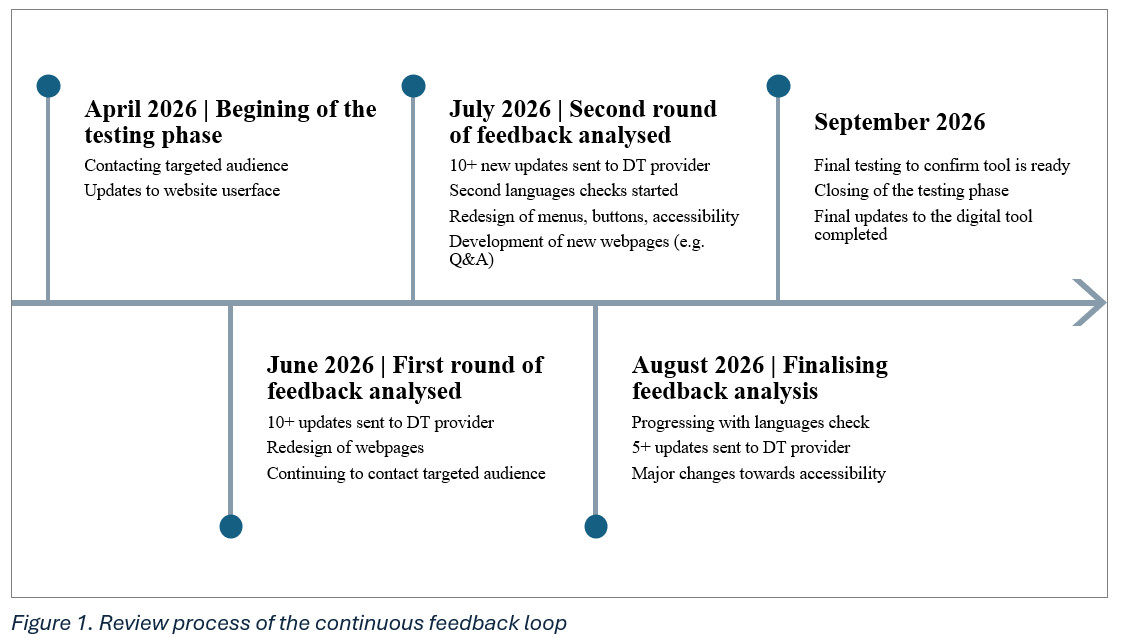 The testing process followed a continuous feedback loop throughout a five-month phase, which ran from the end of April to September 2026. The feedback was collected from a wide range of testers, and the received results – the ratings (scale 1-5), written comments and observations – were analysed thoroughly and regularly. The findings were then categorised and periodically consolidated into a list of suggested improvements and changes, which were shared with the digital tool provider. The digital tool provider implemented the agreed changes throughout the testing period, allowing the tool to be continuously refined based on the testers’ experiences. This allowed the tests to be continuously useful, identify whether the implemented changes were relevant and pinpoint clearly what new changes were recommended. The testing phase closed in September 2026 and the digital tool will be considered final and ready during the autumn, when the final updates are completed.
Confirming the digital tool through intensive testing, what five months of testing revealed and what changes were implemented
 The testing phase involved 135+ people with different personal and professional backgrounds, levels of experience, needs and ways of using digital tools, and hopes for this social sustainability-related digital tool. The tool platform was tested across four countries: Finland, Lithuania, Germany and Austria by various users who could directly benefit from the tool: SMEs, higher education institution students, educators, sustainability experts and consultants, scholars and researchers.
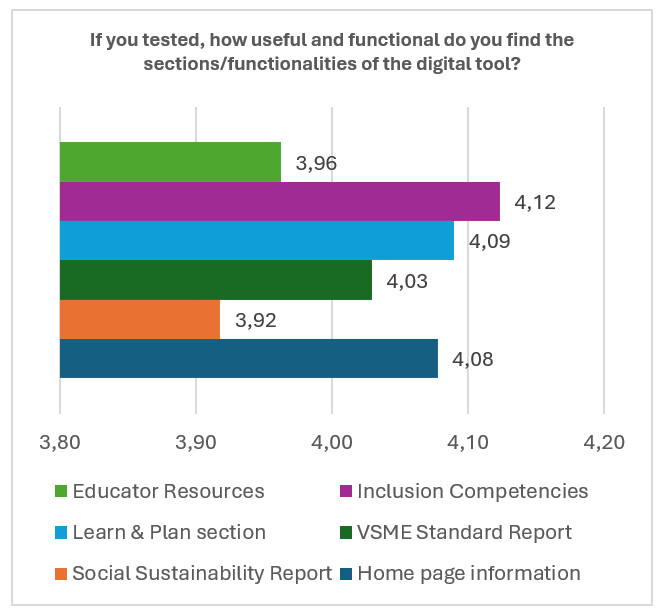
The hope for the test was to identify the users’ pain points and the tool’s quality: what works? what does not work? what could be improved and how? is the digital tool keeping its promise of being a platform where users can report, plan and learn about social sustainability? It was important for our project’s team to gather as much information as possible to update the tool where needed in order to meet as many of the testers’ requirements as possible. For this purpose, our testers were tasked with testing all of the digital tool’s sections and features, provide rankings, screenshots, and open comments. The testers reviewed every page of the tool and its features and the return were largely positive. Overall, the testers found the proposed functionalities useful and functional and reported many suggestions for improvements – most of which were promptly implemented and confirmed to be relevant updates.
In the educator resources, the examples provided were praised to be useful for educational purposes, but educators wished for additional materials to be utilised in the classrooms and further details as to how the tool can be utilized to meet students’ learning expectations. Thus, the University of Vaasa team:
- developed additional resources with educator tips,
- developed exercises to use in the classroom,
- developed guidelines on using the tool with students when performing business simulations with the digital tool.
These were piloted as a Business Simulation course at the University of Vaasa and added online on the digital tool platform.
The Inclusion competencies assessment stood out as well-designed with development suggestions that felt practical and specifics. Testers especially liked the insightful recommendations in the downloadable pdf and the layout of the results. Nevertheless, with the testers’ suggestions, the team worked with the developer to improve this section of the tool:
- format issues when downloading results were fixed
- an improved UX for a more user-friendly and disability-friendly navigation was made, e.g. we increased font size
- questions were reformulated to reduce biases and emphasis on opinion-based statements
- supportive materials for educators and students were added, e.g. resources to understand what biases are and how to reflect on one’s owns.
The Learn & Plan section was reported to be useful in connecting theoretical sustainability concepts with realistic business simulations using practical examples. It was also praised for being efficient in highlighting gaps in a company’s sustainability practices by forcing accountability and deadline-setting. But in the first feedback round, testers found it difficult to locate the Learn & Plan section and understand the need for this first-step when being unfamiliar with social sustainability concepts. Thus,
- the section was moved up in the homepage and centre in the top-menu, adding more clarity and visibility
- definitions were also added and content reorganized as testers wished for more balance with clearer explanations on finding the forms, assessment, and references.
- the page was fully redesigned to keep the most liked features (box & arrows) and rethink organization and content flow.
The VSME Standard Report and the Social Sustainability Report were praised for being easy to fill-in, intuitive, convenient and clear. Testers also enjoyed the professional outlook, the design and the automated calculations. However, testers disclosed that there was a need for more transparency and more information to ensure that anyone could understand the technical vocabulary and calculations, even if they are unfamiliar with the topic and reporting methods. Thus, the team worked to:
- developed info buttons with explicit content (e.g. how are the automated calculation made?)
- clarified the UX when using the report (different menu buttons, option to choose either report based on needs and expectations)
- front page and report pages added for smoother navigation
- built a brand-new glossary page where digital tool users can glance at key terms and concepts mentioned in the reports and overall digital tool webpages.
The testing further revealed that users want to have access to the questions before starting to register their information to better plan and understand what is requested from them in these forms. This was a possibility from the start but the placement of the question was not user-friendly and thus updated to be clearer, allowing users to download all questions without having to go through the online reports first.
The Homepage information, first look on the tool, was also part of the test. Testers mainly gave improvement options that the team was able to develop quickly, and the digital tool developer implemented between the first and second feedback analysis phases. The page was updated to be clearer, less crowded and more organized. The block-like content was shortened, highlighting only the most useful information and directly linking the relevant pages from the homepage.
 The main changes implemented during the five-months feedback phase were tailored to meet the request of the testers:
- new documentations and instructions, e.g. the glossary page or FAQ page
- improved user-experience and accessibility
- changes to the existing features for clarity and transparency
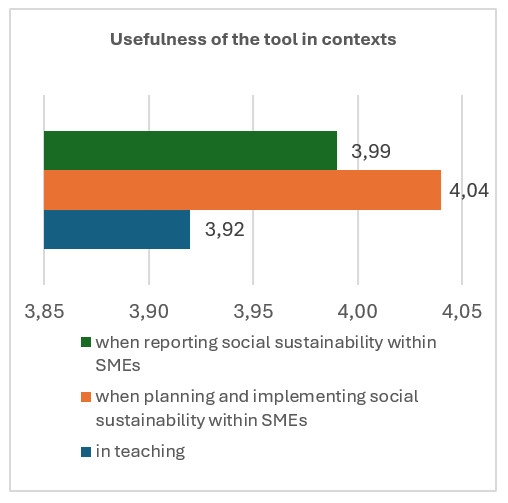
All changes were implemented throughout the testing phase; the testers appreciated the changes and considered the tool as a very useful one across three contexts: when reporting social sustainability within SMEs, when planning and implementing social sustainability within SMEs, and in teaching.
How did feedback from SMEs, Educators and Students differ?
Each profile raised different feedback, and the suggestions for improvement varied greatly. Educators and students liked the practicality of the tool. Their feedback focused more on the need for more instructions, guidelines and examples regarding the tool’s use in educational settings: how can it be used? why should it be used? as an educator, how can I make it into a business simulation? as a student, how do I utilize it with my imaginary business?
Educators’ top 3 favourites feature:
- 17/5 -> Planning tools: Compliance and governance of social sustainability
- Two features tied with 4.14/5 -> Planning tools: Social sustainability in strategic management and Assessment tools: Social sustainability in strategic management
- 13/5 -> Assessment tools: Compliance and governance of social sustainability
Students’ top 3 favourites feature:
- 29/5 -> Inclusion Competencies assessment, results & recommended steps, and downloadable pdf.
- 24/5 -> Assessment tools: Managing people in a socially sustainable way
- Two features tied with 4.23/5 -> Assessment tools: Social sustainability in daily work and routines and Social Sustainability Report downloadable pdf.
SMEs and Entrepreneur’s top 3 favourites features:
- 21/5 -> Planning tool: Social Sustainability in daily work and routines
- 15/5 -> Examples and Resources: Social sustainability in strategic management
- 14/5 -> Examples and Resources: Managing people in a socially sustainable way
SMEs and Entrepreneurs were confident about the intuitiveness and easy navigation between the reports, assessments, forms and informative pages. They focused the suggestions on how to make the tool less lengthy, faster to fill in with reduced resources (time, people, budget), and utilizable across business units: marketing, sustainability, sales, international expansion, etc. This led to numerous improvements, for instance: the downloadable action forms and report questions, and changes to the downloadable pdf reports.
The feedback is analysed and updates were implemented, what’s happening next?
We are beyond thankful to everyone who took the time to test our digital tool website and app, provided valuable feedback and possible improvements. Now that the feedback loop is closed and the implemented changes have been made, the tool is ready for your use in education and business!